http://geographyfieldwork.com/Choropleth2.gif
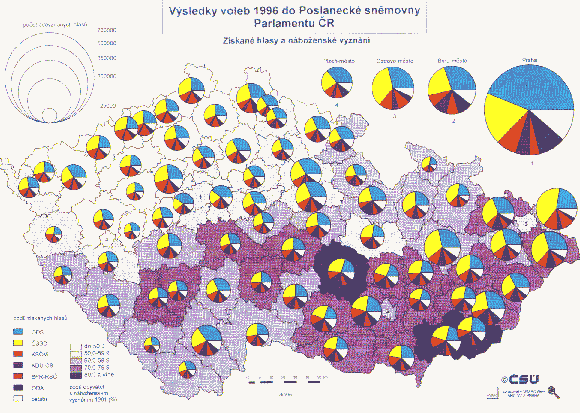
A continuously variable circle map is very similar to a normal circle map, except for the fact that in addition to the variable represented by the actual circle, another variable is represented inside of each of the circles. In this map, the bigger circles represent larger populations, and inside the circle, the variation of the population is represented in the form of a pie chart.

No comments:
Post a Comment