http://www.nehu.ac.in/iqac/img/radar-chart.jpg
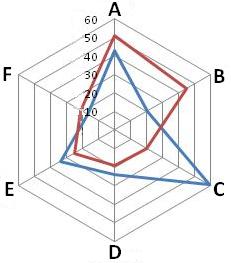
Star plots are used for displaying information about relative values that revolve around a single data value. They are relatively complex to understand, with no prior knowledge on how to read them, but they are unique in the data they represent.
No comments:
Post a Comment