Map Catalog
Thursday, November 22, 2012
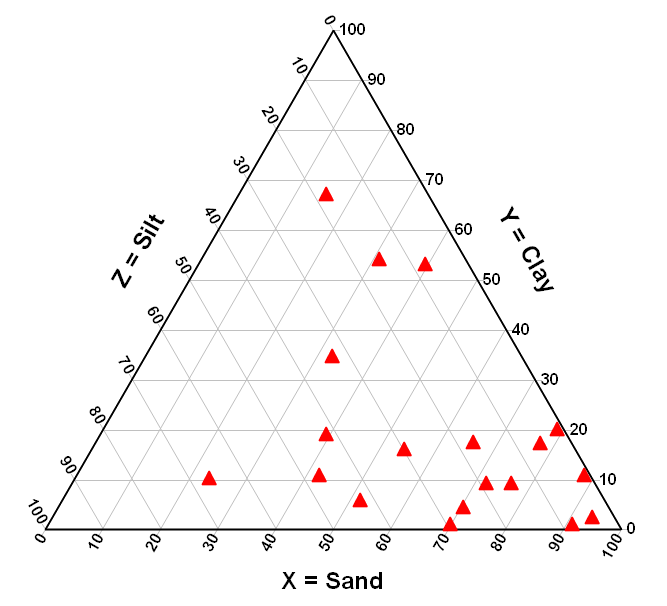
Triangular Plot
http://www.dplot.com/triangle_plot/triangle-plot.png
A triangular plot is a complex graph that compares 3 variables in one graph. The ratios of these variables are placed on the three corners of an equilateral triangle and the tree variable quantities sum up in to one constant value.
No comments:
Post a Comment
Newer Post
Older Post
Home
Subscribe to:
Post Comments (Atom)
No comments:
Post a Comment