http://davidmlane.com/hyperstat/pictures/strength.gif
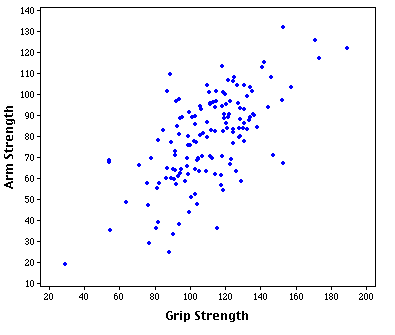
A scatterplot is a map that shows the relationship of two variable quantities, and does so plotting on two axis that meet at a right angle. These graphs show correlation, but can not provide cause and effect. The example above is a scatter plot of grip strength vs. arm strength, but the two do not necessarily base off of each other. There is a positive trend, but there are many outliers and extremities.

No comments:
Post a Comment